Following Smart Money
Understanding ASX Broker Data
INTRODUCTION
When a stock trade happens on the ASX, it's not just about price and volume. Every trade has another crucial piece of information: which broker executed it. This simple fact opens up a fascinating window into market behavior that most traders never see.
Think of broker data as a way to understand who's really behind market movements. When you see a stock price change, broker data tells you whether it's driven by retail investors trading through platforms like CommSec or institutional investors working through professional brokers. It's like having X-ray vision into market sentiment, backed by real money flows.
Why does this matter?
- Not all trading activity is created equal. Institutional investors – the "smart money" – often signal strong conviction based on deep research and analysis.
- Contrarian opportunities arise when retail brokers show heavy selling while institutional brokers are buying.
This ASX broker transaction data, which records every trade and the brokers involved, allows us to:
- Track institutional buying and selling patterns
- Identify accumulation by professional investors before price movements become obvious.
- Distinguish retail trading noise from genuine institutional interest.
- Validate investment ideas with real money flows.
Key Benefits for Traders
- 🎯 Better time entries and exits
- ⚠️ Avoid costly mistakes
- 💡 Identify opportunities before they become obvious to the broader market
At MarketLens, we've built tools to help you interpret these patterns easily. Instead of raw transaction data, you see clear visualizations of broker activity trends, helping you spot opportunities where professional investors are quietly building positions.
In this guide, we'll show you exactly how to read these patterns and use them in your trading decisions. We'll walk through real examples where broker flow analysis highlighted significant opportunities and share the specific patterns that successful traders watch for.
FROM THEORY TO PRACTICE: UNDERSTANDING BROKER DATA THROUGH A REAL EXAMPLE
The NAB Case Study
Let's examine a revealing case from the National Australia Bank (NAB) during late 2023. From August to November, while NAB's stock price moved sideways showing no clear direction to casual observers, a significant shift in ownership was taking place beneath the surface.
Understanding the Broker Data
Before diving into the example, let's understand how broker data is aggregated. MarketLens processes raw ASX transaction data to show the cumulative trading activity for each broker over a selected period. For each broker, we calculate:
- Total shares bought by their clients
- Total shares sold by their clients
- Net position (bought minus sold)
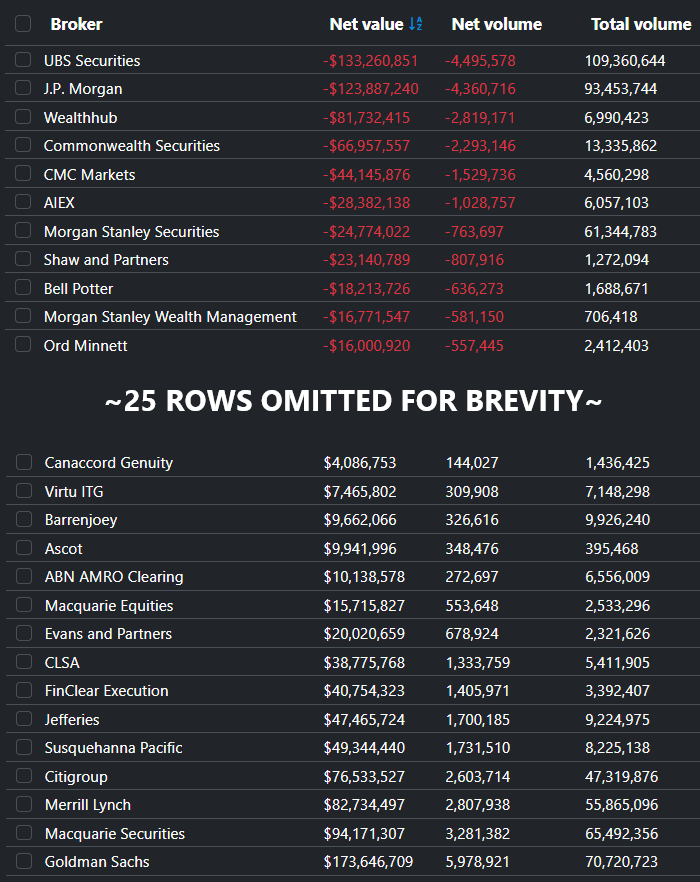
For example, if data shows that J.P. Morgan has a net volume of "-4,360,716", this means their clients sold 4,360,716 more shares than they bought during the period – indicating negative sentiment from J.P. Morgan's clients.
What This Data Tells Us
Top Sellers:
We see retail-focused brokers like CommSec, AIEX, and CMC Markets showing significant selling activity. This often indicates retail investors reducing their positions.
Top Buyers:
Institutional brokers like Goldman Sachs, Macquarie Securities, and Merrill Lynch are net buyers. This suggests professional investors are accumulating positions while retail investors sell.
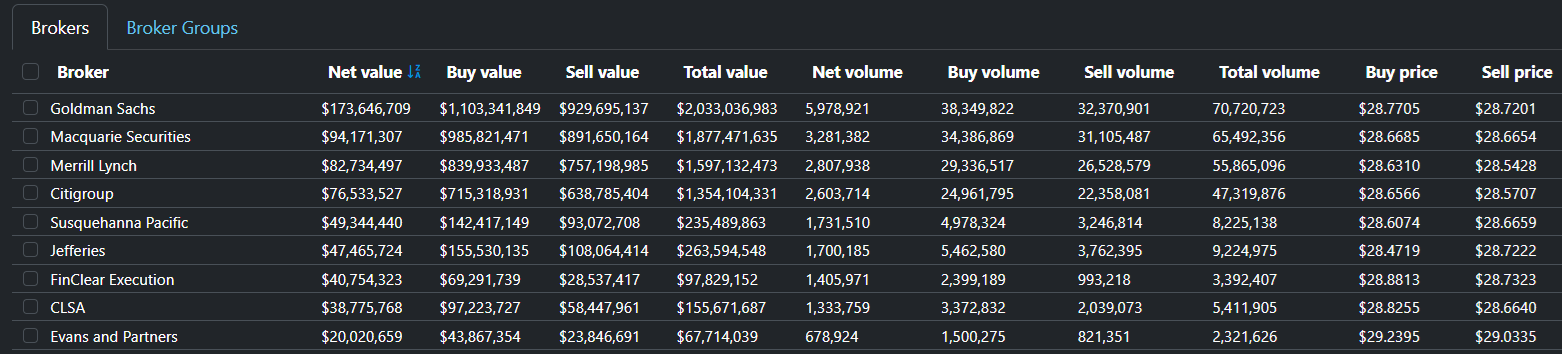
For a deeper analysis, we can examine the expanded broker activity table, which provides additional metrics, including buy and sell values, total volumes traded, and average buy and sell prices for each broker.
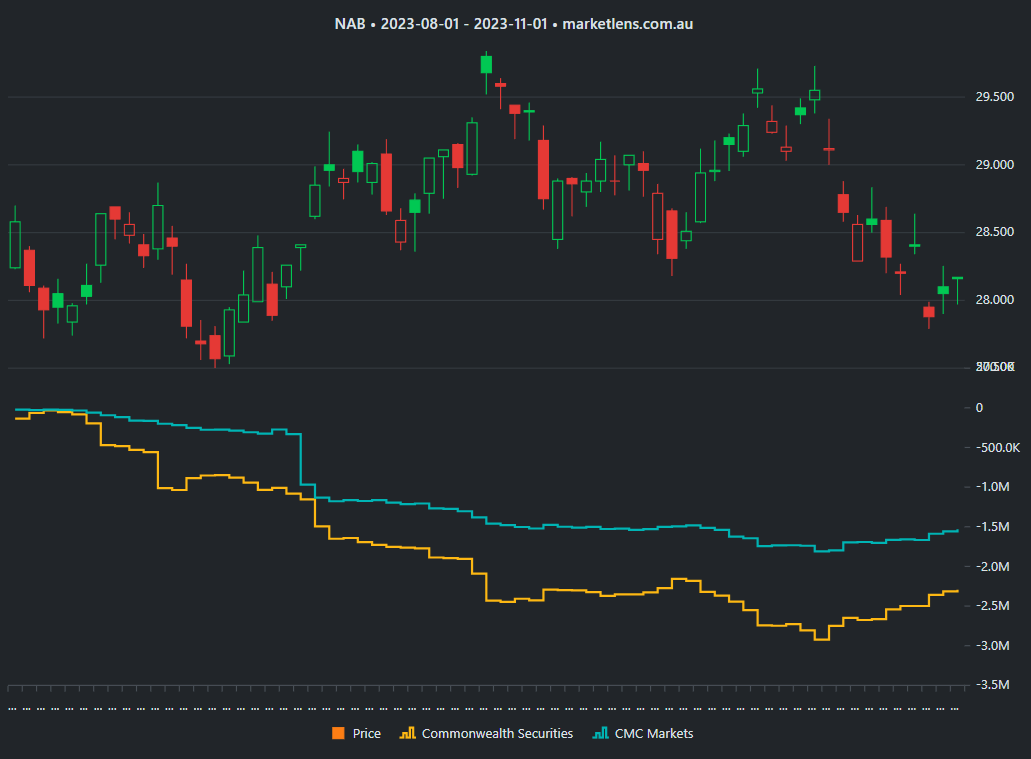
Visualizing Trading Patterns
While tables provide detailed data, MarketLens offers a unique chart view that makes these patterns easier to spot and analyze. The chart combines price action with broker activity, showing accumulation or distribution trends over time.
In this visualization, we can track individual broker activity through step-lines displayed beneath the price chart. For example, looking at Commonwealth Securities and CMC Markets – both retail brokers – we can see a clear selling trend developing over the period.
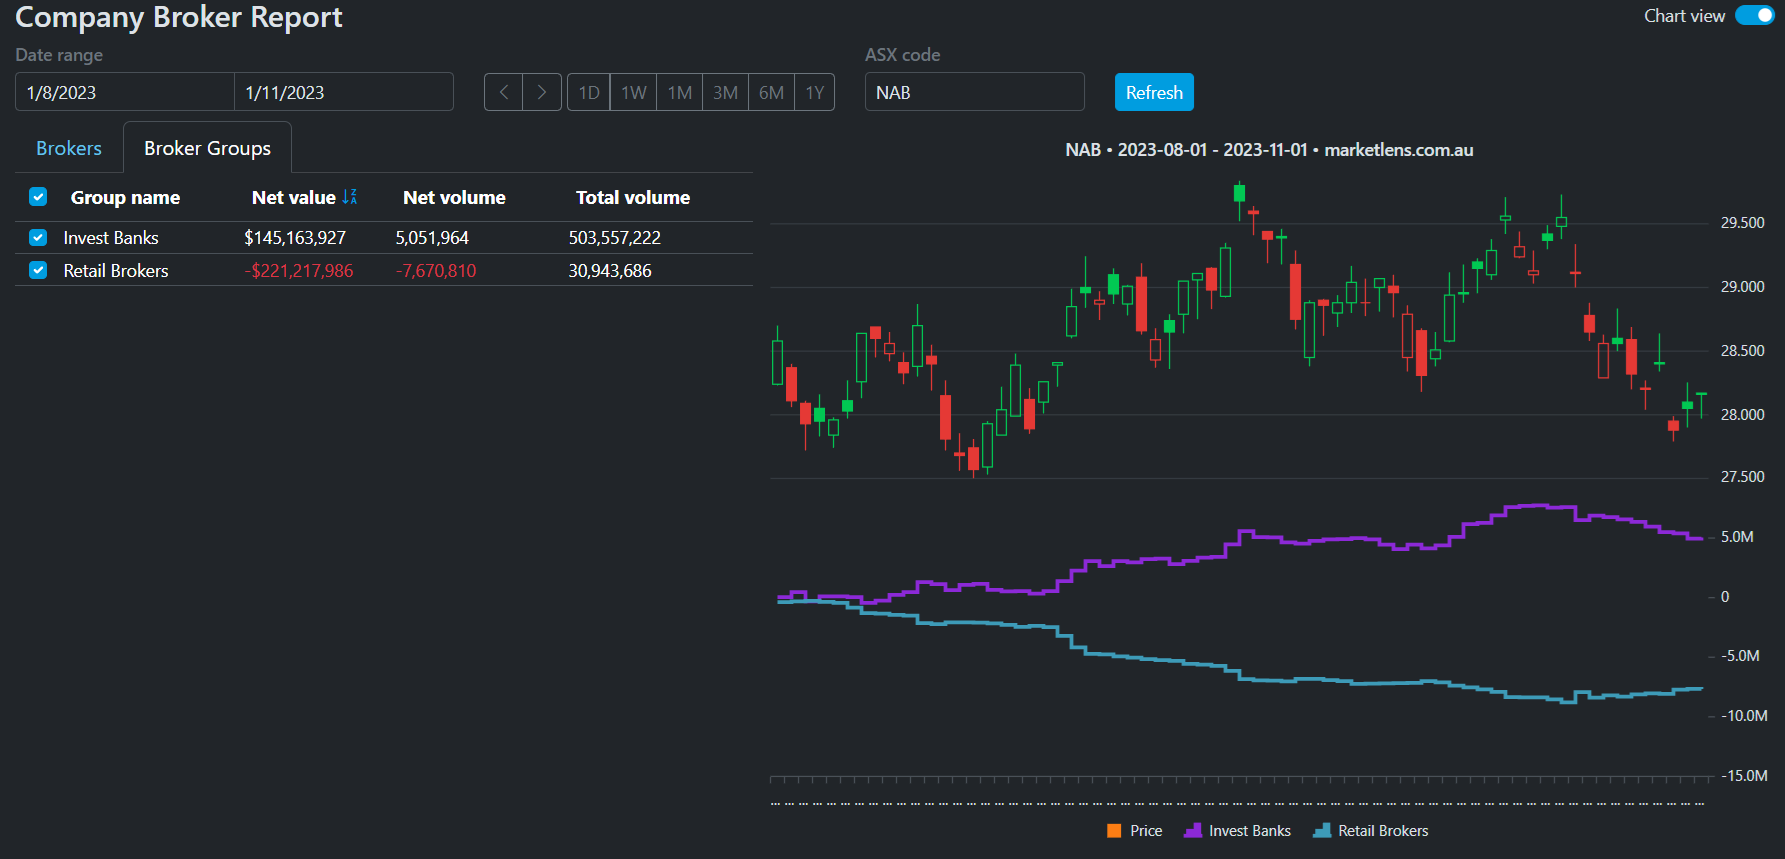
The Power of Group Analysis
To make these patterns even more apparent, MarketLens allows you to create custom broker groups. Let's analyze two key groups:
Investment Banks:
- Citigroup
- Goldman Sachs
- Macquarie Securities
- Merrill Lynch
- J.P. Morgan
- Morgan Stanley Securities
- UBS Securities
Retail Brokers:
- Commonwealth Securities
- AIEX
- CMC Markets
- WealthHub
By grouping brokers this way, we can see the combined impact of retail versus institutional trading activity.
This group view reveals a striking divergence: while retail brokers were consistently selling, investment banks were steadily accumulating positions.
A Powerful Signal Unfolds
Let's fast-forward to see how this institutional accumulation played out.
Following our initial analysis period (August to November 2023), a significant move began to take shape. In December 2023, NAB's price decisively broke through its resistance level at $29.60, strongly supported by continued institutional buying. By March 2024, the price had climbed to $33.50 – a substantial move that was indicated by the earlier institutional accumulation.
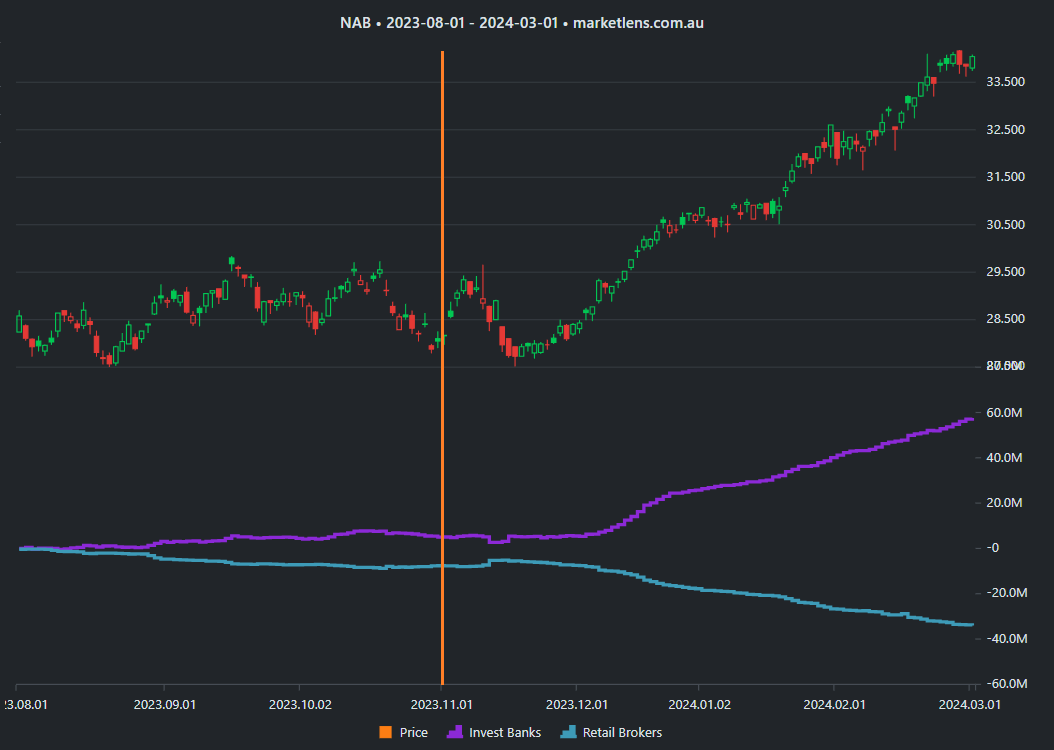
This case demonstrates how following broker flow could have helped identify a timely entry point, as institutional accumulation preceded the significant price move.
Understanding Professional vs Retail Behavior: A Deeper Dive
The Psychology of Smart Money vs Retail
Professional investors typically:
- • Accumulate positions during periods of low sentiment
- • Sell systematically into strength and price spikes
- • Position themselves ahead of major announcements
- • Assess fundamental factors before reacting to news
In contrast, retail investors often:
- • Sell out of fear during market uncertainty
- • Chase momentum and buy near price peaks
- • React to news after it's announced
- • Average down on losing positions without considering structural issues
These behavioral differences create opportunities. When you see retail brokers selling while institutional brokers are buying, it often signals a potential opportunity – professional investors are seeing value that the retail crowd is missing.
Key Patterns to Watch
1. Smart Money Timing
- • Professional investors often accumulate positions during periods of low sentiment
- • Institutional buying frequently precedes significant price movements
2. Retail Trading Patterns
- • Retail investors tend to sell during periods of uncertainty
- • Retail selling can mark excellent entry points when accompanied by institutional buying
Real-World Applications: News, Trends, and Market Timing
Let's explore two real-world examples where broker data provided critical insights into market behavior. These cases highlight how broker flow analysis helps investors interpret news events and recognize significant trend changes.
Case Study 1: Life360 (360.AX) - Understanding News Impact
Period: January–June 2024
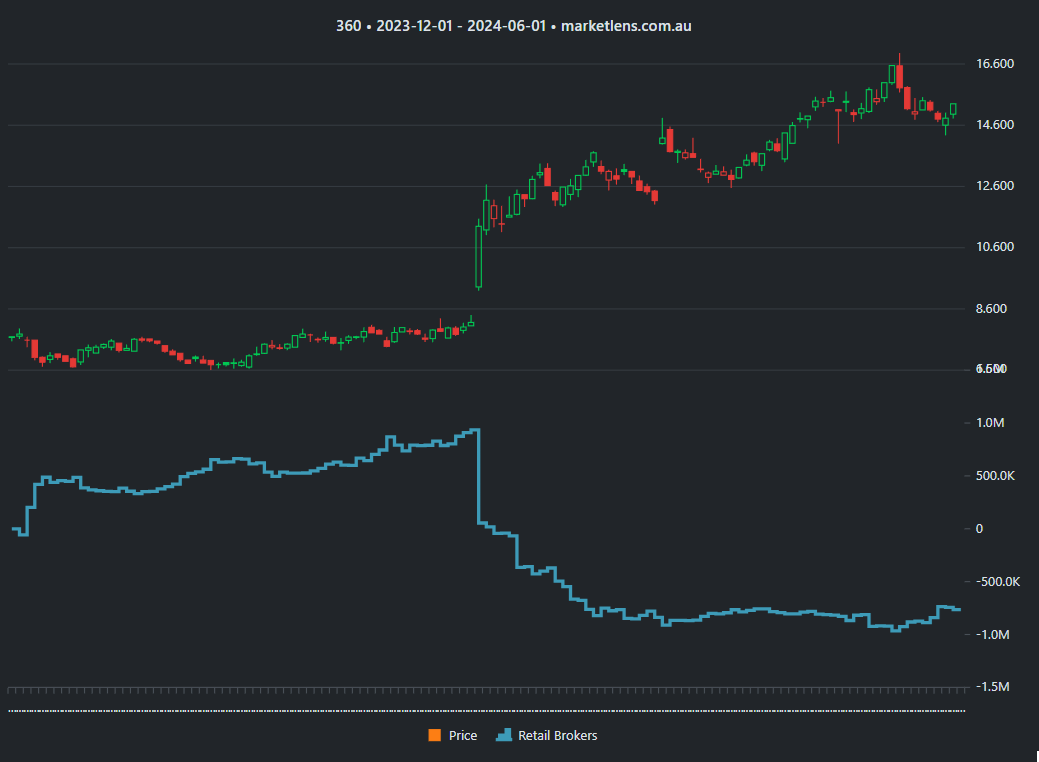
On March 1, 2024, Life360 reported its 2023 financial results, triggering a dramatic 35% price surge in a single day. For many investors, such a sharp rise might seem like a missed opportunity. However, the broker data revealed a deeper story.
What the Data Revealed:
- • Retail investors sold more shares in one day than they had accumulated over the previous three months
- • This substantial retail distribution continued over the following month
- • Meanwhile, professional investors actively bought, seeing deeper value in the company's results
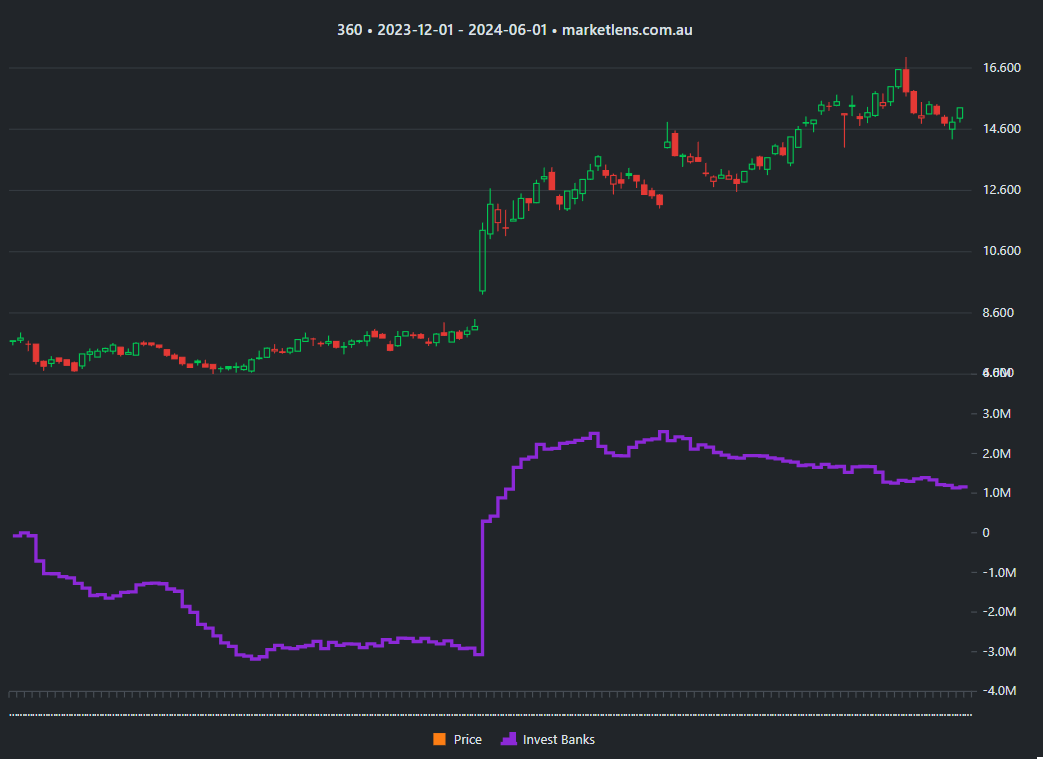
The Investment Bank Response
Looking at the activity of major investment banks, including Goldman Sachs, Macquarie Securities, and UBS Securities, we see a mirror image of retail behavior.
Investment banks exhibited a strong buying pattern, suggesting that despite the price surge, professional investors saw additional upside potential based on the annual report's implications. This conviction proved accurate, as the price climbed an additional 50% in the following three months.
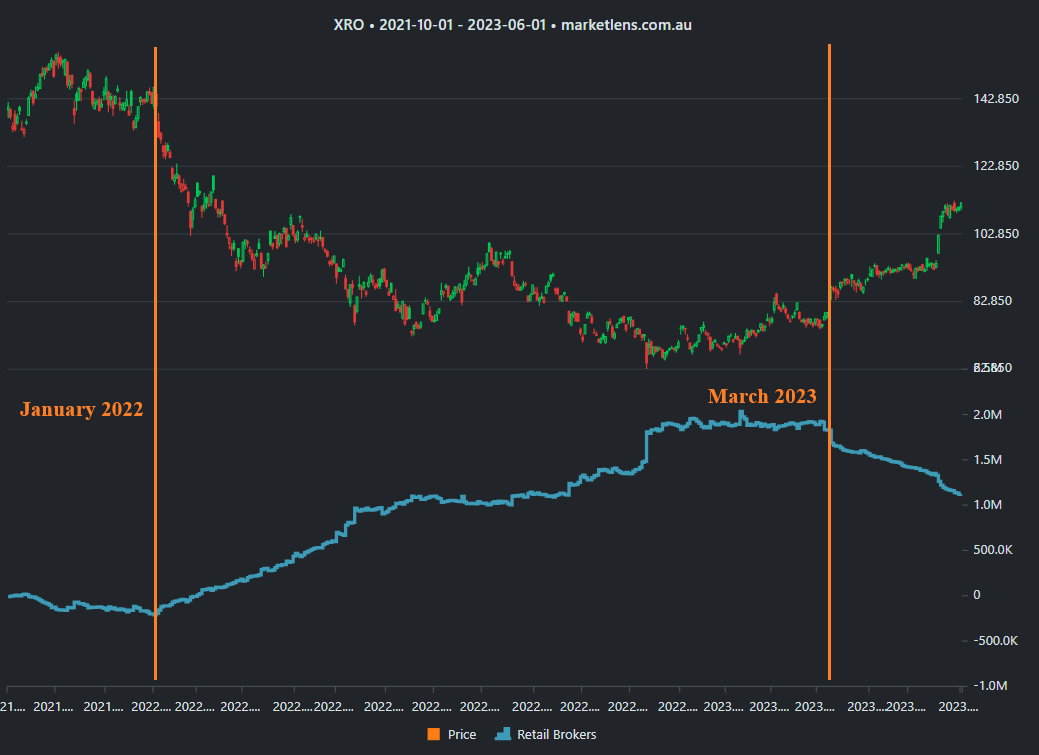
Case Study 2: Xero (XRO) - Navigating Fundamental Changes
Period: July 2021–October 2023
This extended example demonstrates how broker data can help investors avoid averaging down during deteriorating fundamentals and recognize genuine turnaround opportunities.
Key Turning Points:
1. January 2022: The Pivot
- • Retail investors shifted from selling to buying
- • Professional investors began distributing shares due to changing fundamentals
- • The stock subsequently declined about 50%
2. March 2023: The Turnaround
- • First signs of stabilization appeared in broker accumulation patterns
- • Positive half-year results triggered a sentiment shift
- • Professional buyers returned while retail investors began selling
- • The price rose 80% over the next six months
Key Lessons from These Examples
1. News Impact Assessment:
- • Sharp price moves on news don't necessarily mean it's "too late."
- • Professional buying after news can signal sustained momentum
- • Watch for divergence between retail and professional reactions to news
2. Trend Change Recognition:
- • Exit early when fundamentals deteriorate and professionals are selling
- • Avoid catching falling knives without confirmation from broker data
- • Look for professional accumulation as a signal of genuine turnarounds
Finding Opportunities with the Broker Screener
The ASX hosts over 1,800 companies across various sectors and market caps. How can you identify the most promising opportunities across such a vast market? This is where MarketLens' Broker Screener becomes invaluable.
Pre-Reporting Season Strategy
Before the reporting season, professional investors – particularly investment banks – often position themselves ahead of key announcements. Let's explore an example of how the Broker Screener could be used during July 2024.
For instance, we could track the accumulation of shares by a specific group of brokers, such as seven major investment banks. By narrowing the search further with filters like market capitalization and industry sector, we can identify stocks with the most significant collective activity from the selected brokers.
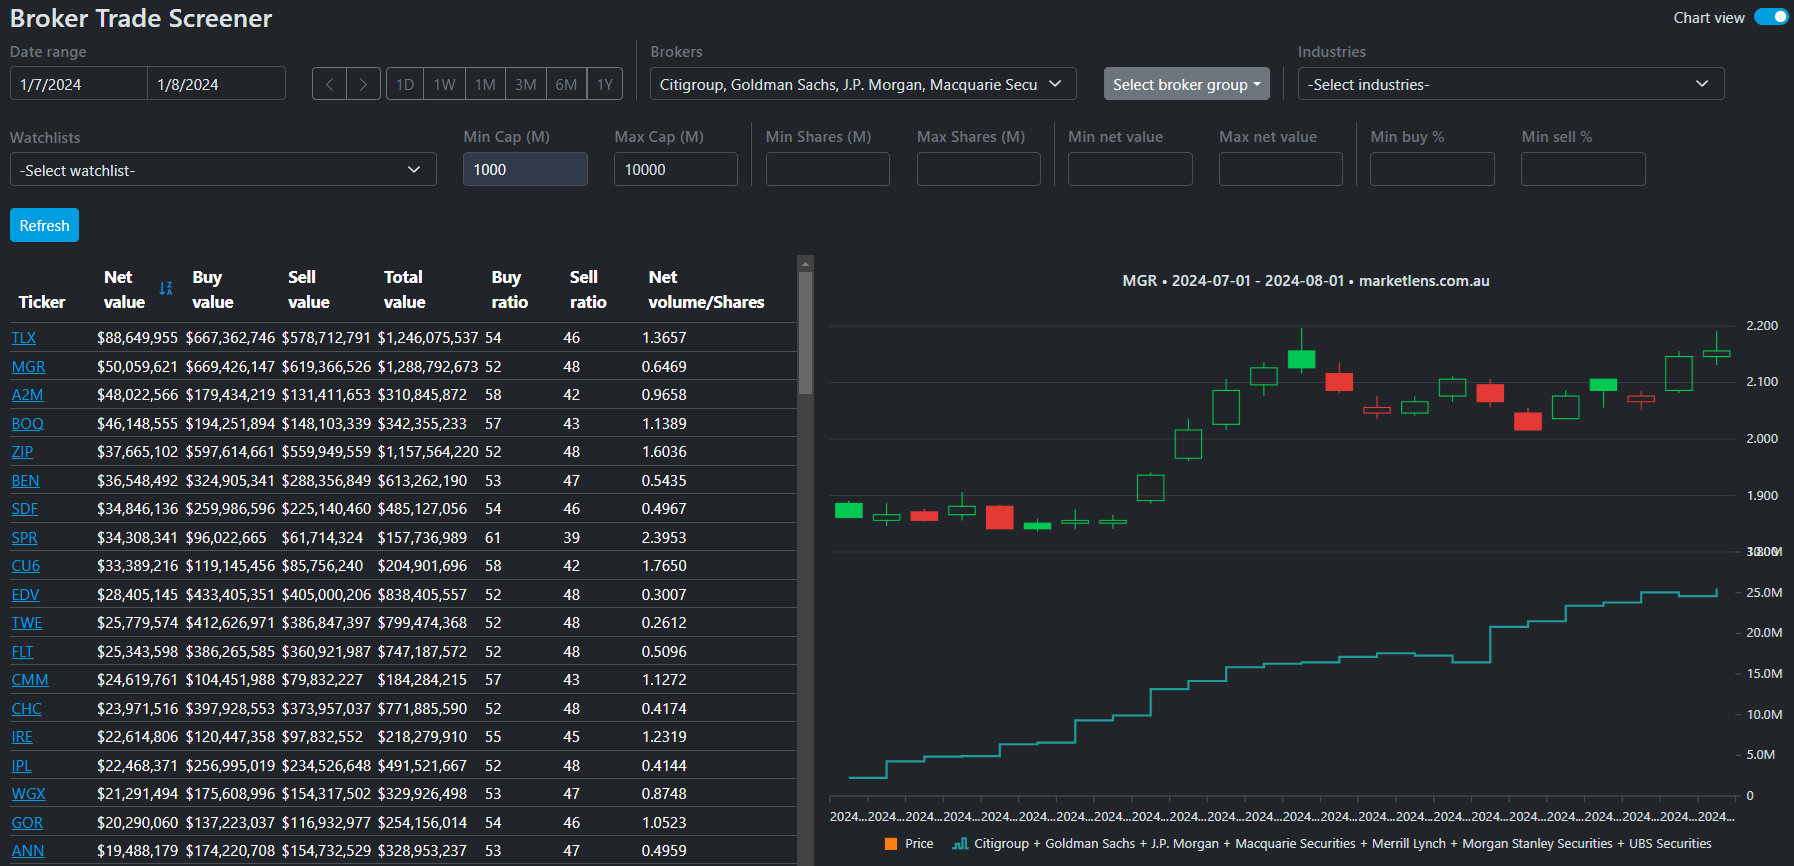
These results provide a focused starting point for deeper investigation.
Sector-Specific Screening: Gold Producers Example
The screener becomes even more powerful when combined with custom watchlists. For example, if you're focused on major gold producers, you can:
- Create a watchlist of your target companies (e.g., nine major gold producers)
- Screen for retail broker activity, using a group of four retail brokers
- Look for significant retail selling during a specific period (e.g., September 2024)
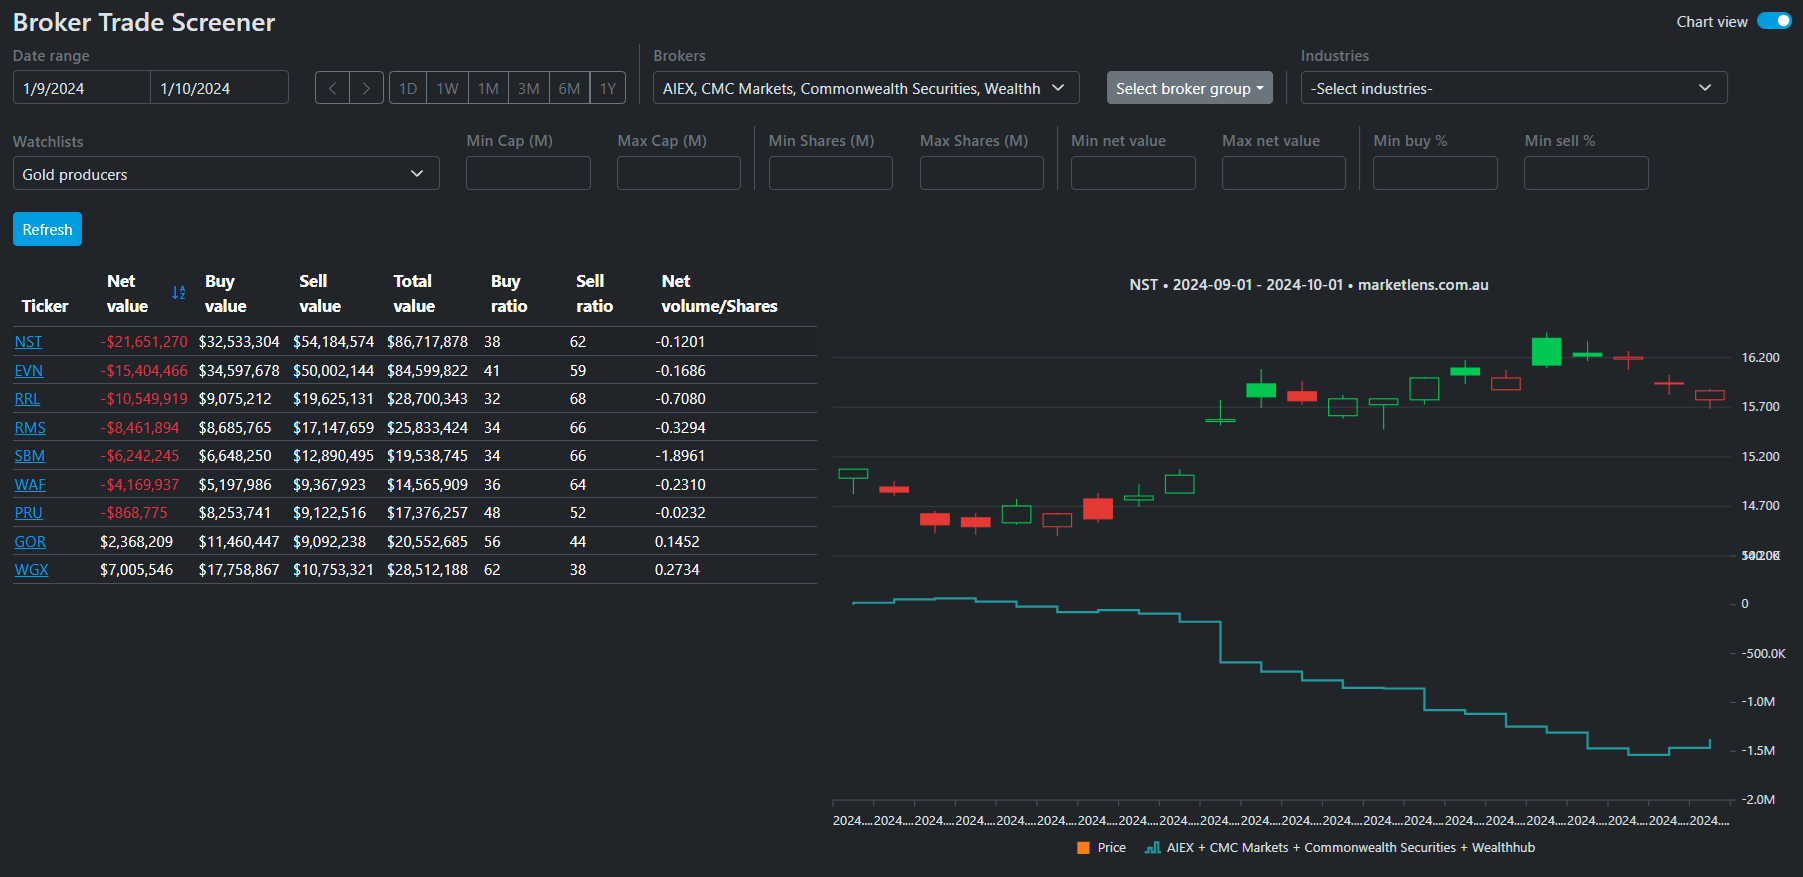
In this example, the screener reveals that Northern Star Resources (NST) saw the highest retail distribution during this period. This significant retail selling, likely absorbed by professional investors, flags NST as a candidate for closer investigation.
Conclusion
Understanding broker flow provides a unique window into market dynamics that most traders never see. By tracking the divergence between retail and professional trading patterns, investors can:
- • Better time their entries and exits
- • Avoid costly mistakes
- • Identify opportunities before they become obvious to the broader market
The combination of detailed broker reports and the powerful Broker Screener enables investors to both analyze specific stocks deeply and scan the entire market for emerging opportunities. Whether you're tracking institutional accumulation before reporting season or monitoring smart money movements in your favorite sectors, broker flow analysis adds a crucial dimension to your investment toolkit.
Remember: Professional investors often see value before the market does. By following their money flow through broker data, you can position yourself alongside the smart money rather than following the retail crowd.
Start analyzing broker data today
Join successful ASX traders who use MarketLens to follow smart money, validate trading ideas, and discover opportunities before they become obvious to the market.
MarketLens: Your window into ASX broker data and smarter trading decisions.