How to Profit from Tax Loss Selling: The Smart Money Playbook
The June Selling Frenzy: When Panic Creates Profit
Every June, a predictable drama unfolds across Australian stock markets. As the financial year draws to a close, retail investors frantically review their portfolios, hunting for losing positions to sell. The strategy is simple: crystallise losses to offset gains and reduce the tax bill. But this mass exodus creates a fascinating opportunity for those who know where to look.
While amateur investors are dumping quality stocks at fire-sale prices, professional money managers are quietly doing the opposite. They're buying. This isn't coincidence—it's a well-documented pattern that repeats every tax season. The question isn't whether this opportunity exists, but whether you can spot it happening in real-time.
The secret lies in understanding not just what's being sold, but who's selling—and more importantly, who's buying. This is where most retail investors miss the boat. They see falling prices and panic. Professionals see falling prices and start calculating position sizes.
- 📅 June creates predictable retail selling pressure
- 💰 Professional investors use this as a buying opportunity
- 🎯 Quality stocks often get hammered alongside poor performers
- 🔍 Broker data reveals who's really buying and selling
Broker Data 101: Your Window Into Smart Money Movement
Think of broker data as the stock market's version of security camera footage. Every time someone buys or sells shares on the ASX, that transaction gets recorded with a "broker code"—a unique identifier showing which brokerage firm handled the trade.
Here's where it gets interesting: different types of brokers serve different types of clients.
Understanding Broker Types
Retail Brokers
Examples: CommSec, NAB Trade, SelfWealth
Primarily serve individual investors—people trading from their kitchen tables and home offices. When you see heavy selling from these brokers, it often signals emotional decision-making: panic selling, tax loss harvesting, or "I need the money" trades.
Institutional Brokers
Examples: UBS, Goldman Sachs, Macquarie
Serve professional fund managers, superannuation funds, and high-net-worth clients. These trades typically represent calculated, research-driven decisions backed by teams of analysts and millions in resources.
Boutique Brokers
Examples: Petra Capital, Euroz Hartleys, Shaw and Partners
Occupy the middle ground. They serve sophisticated private clients, smaller funds, and emerging companies. Their trades often signal informed money that's nimble enough to act on opportunities quickly.
The magic happens when you can see these different player types moving in opposite directions. Retail selling while institutions buy? That's your signal that smart money sees value where the crowd sees disaster.
Market Decline vs Company Decline: How to Tell the Difference
During tax season, the entire ASX typically experiences selling pressure. Quality companies with strong fundamentals often get hammered alongside genuinely troubled businesses. The challenge for investors is distinguishing between temporary market mechanics and fundamental deterioration.
This is where broker data becomes invaluable. Let's examine two real examples from the May-June 2024 tax selling season.
Case Study 1: Zip Co Limited (ASX:ZIP) - The Recovery Play
Zip Co's journey perfectly illustrates why context matters when evaluating stock declines. After peaking at $14 in 2021, the buy-now-pay-later pioneer experienced a devastating fall, dropping to $6 by October 2021 and eventually touching $0.30-$0.60 in 2023.
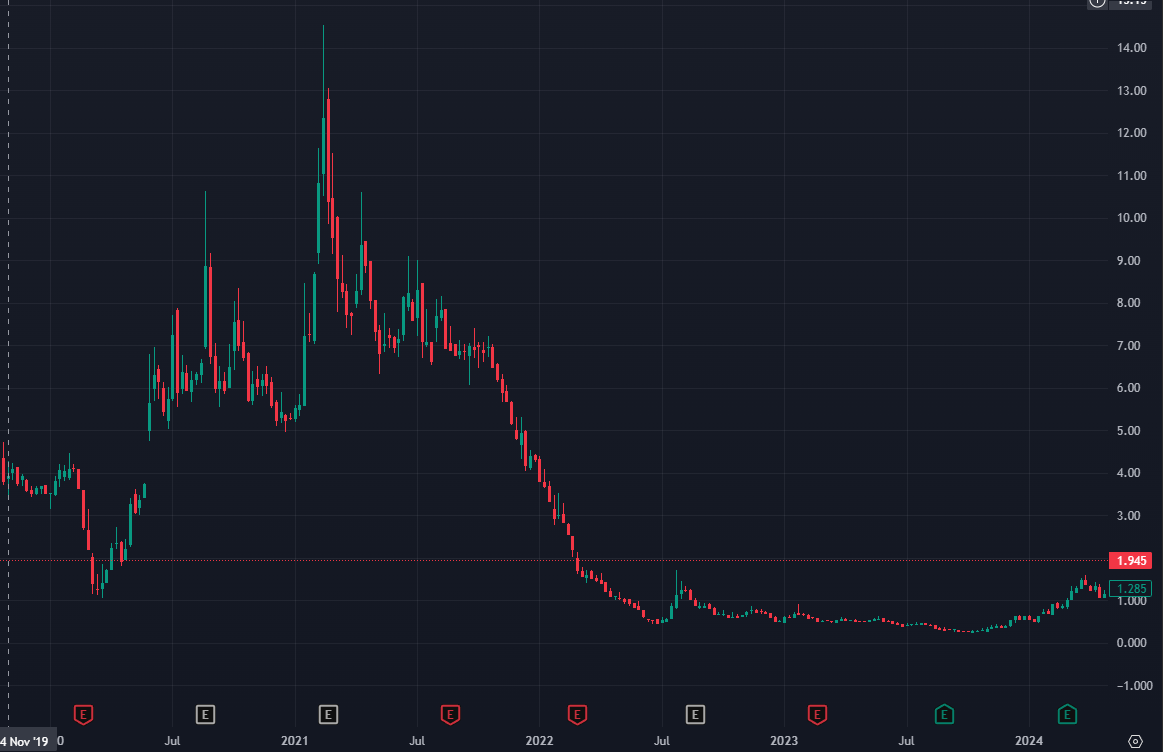
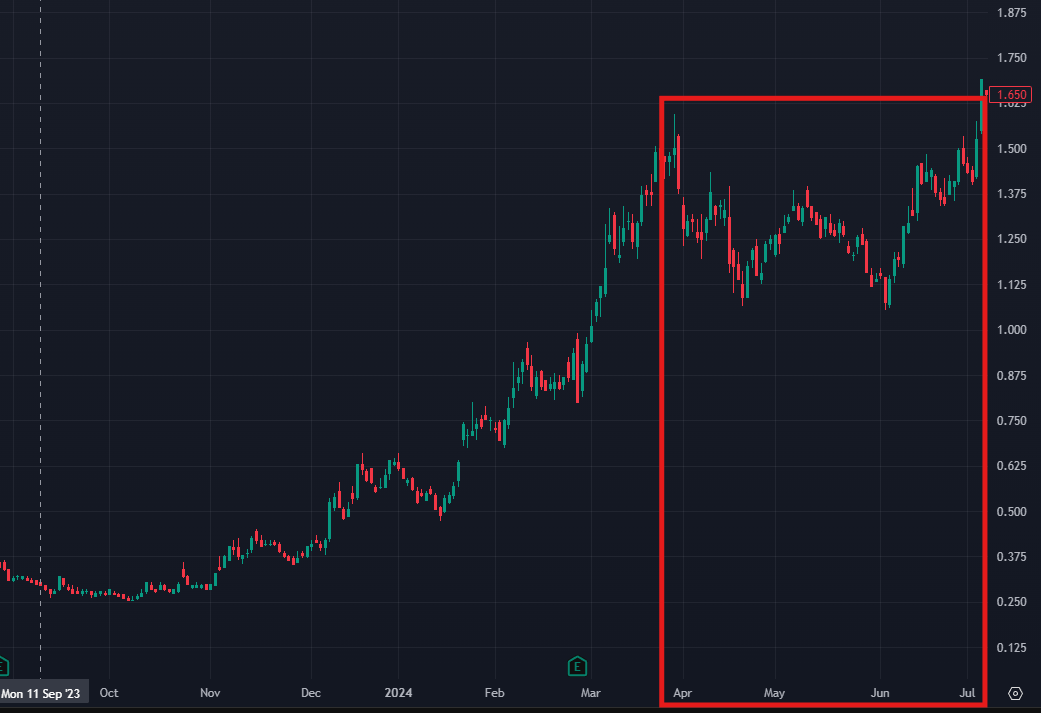
However, 2024 told a different story. The company began recovering, climbing from those lows to reach $1.57 during the first half of the year—a substantial recovery that suggested the business was stabilising.
Then came the May-June 2024 tax selling season. ZIP's price began falling from its $1.57 highs, creating a crucial question for investors: Was this a continuation of the company's earlier troubles, or simply market mechanics pulling down a recovering stock?
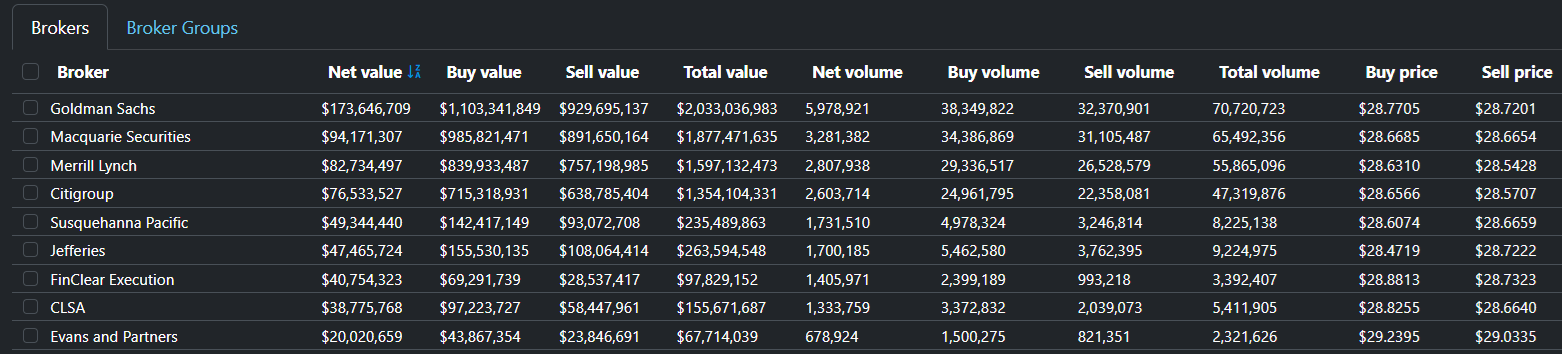
The broker data provided the answer. While retail investors were selling their positions—likely crystallising losses from their higher-cost holdings—investment banks were collectively buying.
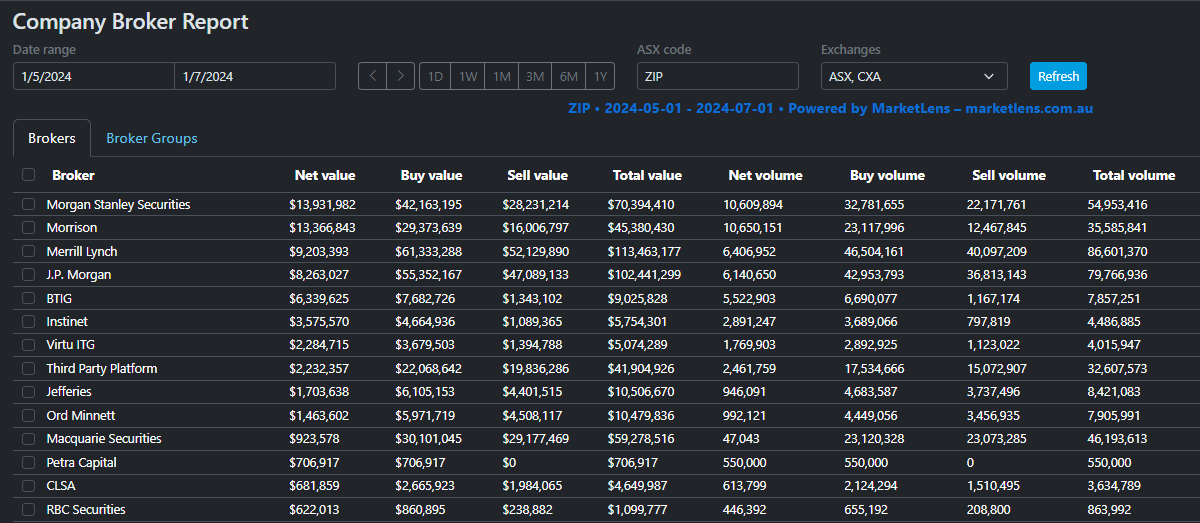
This divergence revealed something critical: professional money saw ZIP's decline as an opportunity, not a warning sign. They viewed the tax selling pressure as temporary noise masking a genuine recovery story.
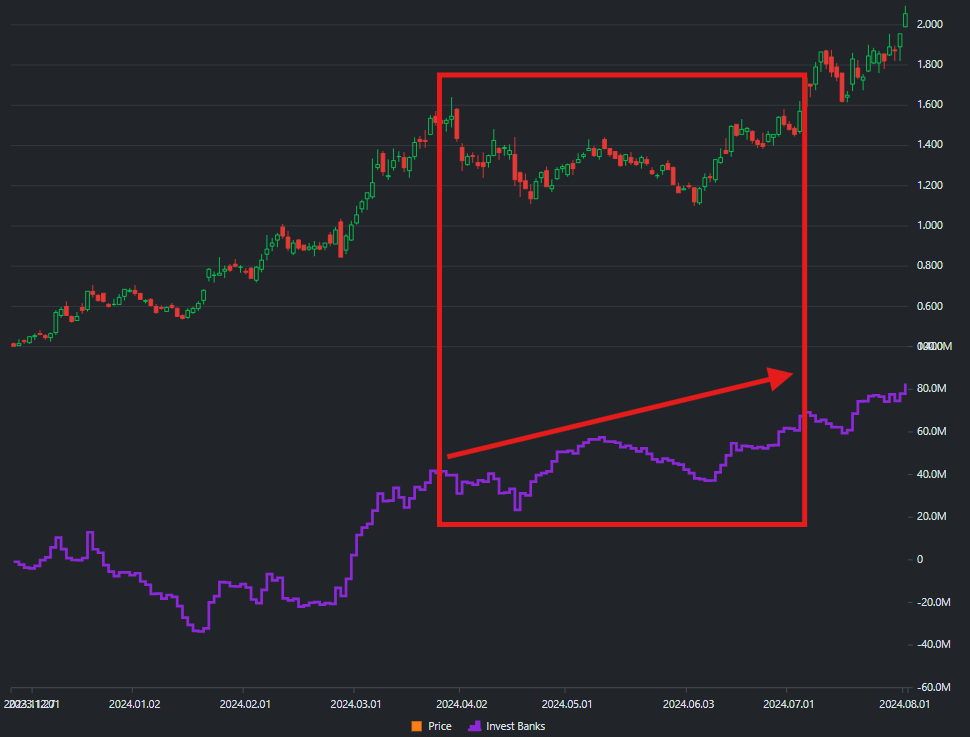
The lesson? When broker data shows institutions accumulating during retail panic, it often signals that the price decline is driven by market mechanics rather than fundamental deterioration.
Case Study 2: Evolution Mining (ASX:EVN) - Gold in the Rough
Evolution Mining provided another textbook example during the same period. The gold miner experienced a correction from $4.30 to $3.30 during May-June 2024, raising the question: Was this commodity weakness or tax selling pressure?
The broker data again provided clarity. Investment banks collectively increased their holdings, buying more than they sold throughout the correction period.
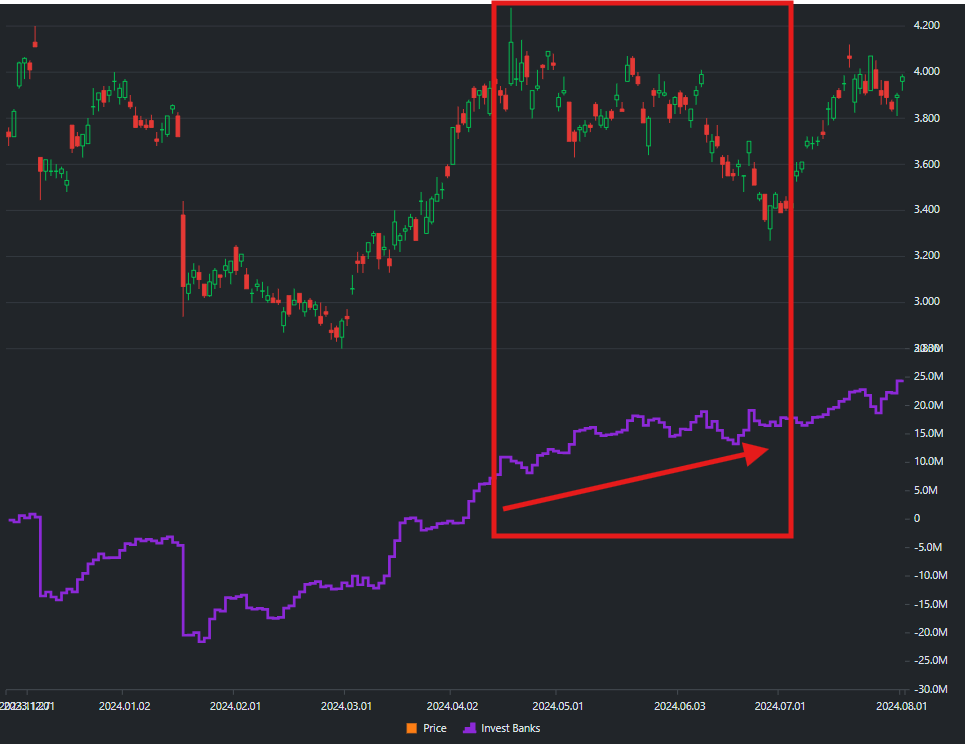
This pattern suggested that professional money viewed the gold miner's decline as a temporary dislocation rather than a fundamental concern about the company or gold prices.
Tax season creates predictable selling pressure that often indiscriminately affects quality and poor companies alike. Broker data helps you distinguish between the two by showing you what professional money is actually doing while retail investors panic.
Small Cap Signals: The Boutique Broker Advantage
In the micro and small cap space, the major investment banks are often absent. Their focus typically remains on larger, more liquid stocks that can accommodate institutional-sized positions. However, this doesn't mean small caps lack professional oversight.
Boutique brokers fill this gap, serving sophisticated private clients, family offices, smaller institutions, and company insiders. These firms include specialists like:
- Argonaut Securities (resource focus)
- Euroz Hartleys (Perth-based growth companies)
- Petra Capital (technology specialist)
- Taylor Collison (diversified institutional)
- Shaw and Partners (sophisticated private clients)
- Morgans (national institutional reach)
What makes boutique broker activity particularly valuable in small caps is its binary nature. For many smaller companies, these professional brokers either buy, sell, or do nothing. When they act, it's typically meaningful—they've identified enough value or risk to justify engagement.
During tax selling season, boutique brokers often step in when retail investors dump small cap positions. Their activity provides a crucial signal about informed money movement in companies that might otherwise lack professional coverage.
Professional Shopping Lists: How Boutique Brokers Hunt for Value
Some Australian brokers provide their clients with carefully curated shopping lists for tax loss season. They conduct thorough research beforehand and identify oversold companies that may provide exceptional value when others are selling purely for tax purposes.
One such broker is Morgans, which consistently produces detailed analysis for tax season opportunities. These aren't random picks—they represent weeks of research into fundamentally sound companies that have been caught up in broader market selling.
Case Study: Morgans and Avita Medical (ASX:AVH)
Avita Medical experienced a sharp price decline during the first half of 2024, falling from $5.50 to $2.50—a 55% drop that made it an obvious candidate for tax loss selling. However, Morgans saw opportunity where others saw only losses.
The broker advised their clients to consider AVH for accumulation during this period. This type of professional recommendation can be tracked through broker data if you know where to look.
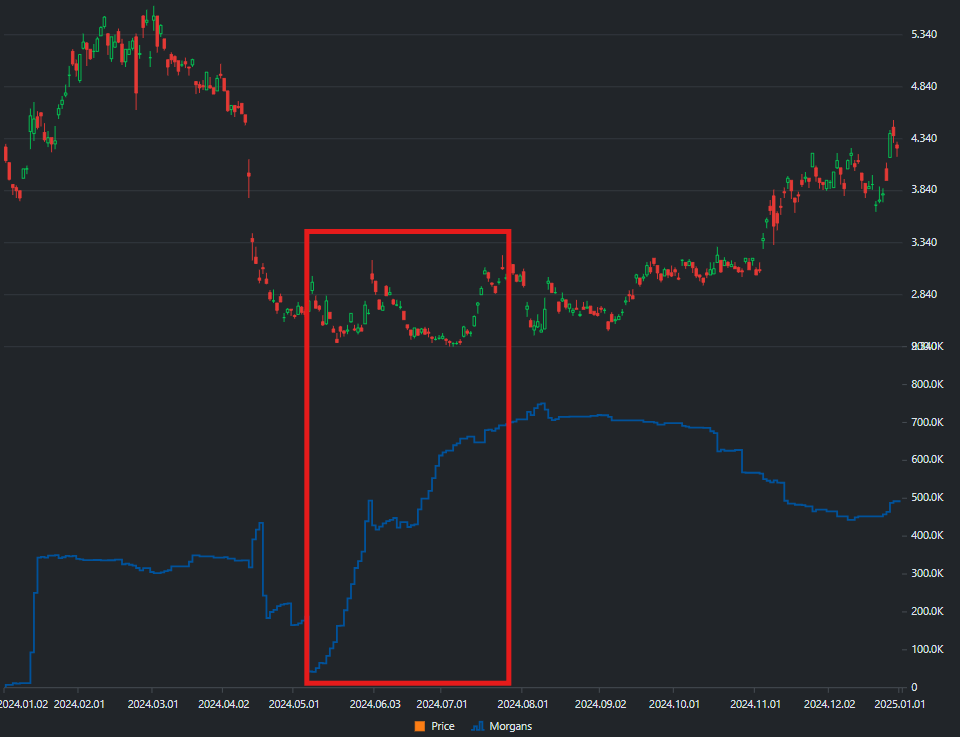
The Company Broker Report on MarketLens reveals the strategy in action. During May-June 2024, we can observe aggressive accumulation of AVH shares by Morgans clients at prices between $2.50-$2.80. A few months later, these same clients were selling at $3.30-$4.00—capturing gains of 30-60% by following their broker's tax season guidance.
This pattern demonstrates the value of tracking boutique broker activity: when professionals with research resources identify tax selling opportunities, they often act decisively and profitably.
Precision Plays: Petra Capital's Small Cap Strategy
We also observe interesting behavior from specialized boutique brokers like Petra Capital in the small cap space. As a technology-focused institutional broker, Petra Capital's activity in small companies often signals informed money recognizing value that broader markets have missed.
Case Study: Petra Capital and Avenira Limited (ASX:AEV)
Avenira Limited provides a perfect example of boutique broker precision during tax season. Over the past year, the company's share price had declined dramatically from 4 cents per share to just 0.4 cents in May-June 2024—a 90% decline that made it an obvious candidate for tax loss selling.
However, where retail investors saw only disaster, Petra Capital or their clients identified opportunity. The broker executed what can only be described as a precision play: buying during May-June at 0.5 cents per share and selling three months later at 1 cent—doubling their money while others were crystallizing losses.
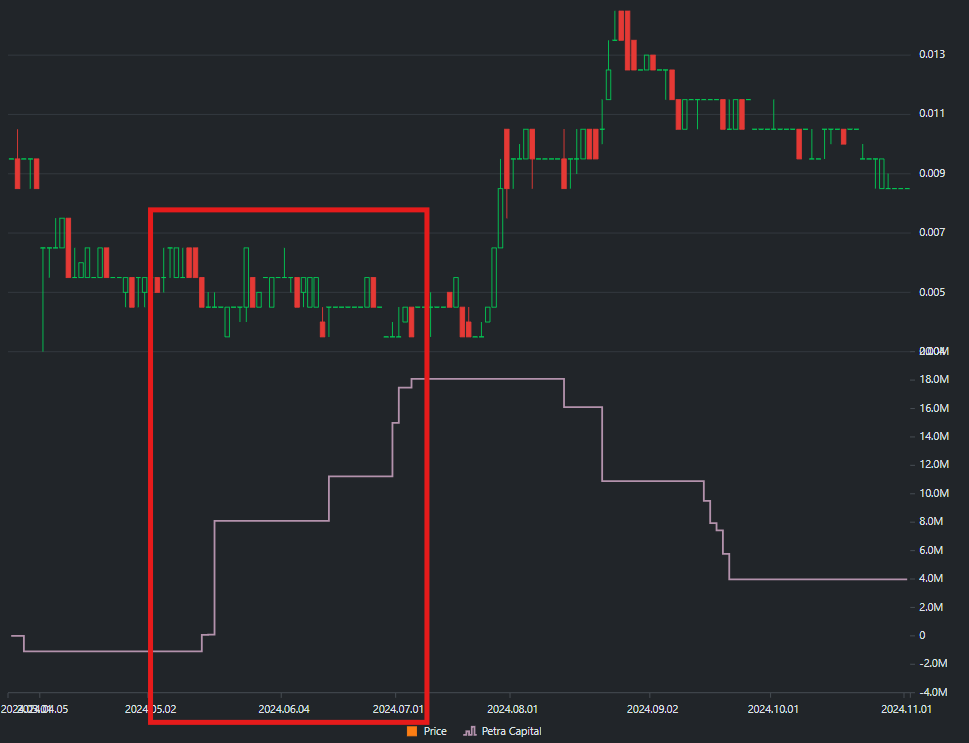
The significance isn't just the percentage gain, but the timing and decisiveness. This wasn't a large volume play—it was a calculated bet by professionals who saw value at distressed prices and had the patience to wait for the market to recognize it.
The Binary Signal in Action
What makes these boutique broker signals particularly valuable is their binary nature. Unlike major institutions that might gradually build positions over months, boutique brokers often make decisive moves that clearly signal their conviction.
When Petra Capital bought AEV at 0.5 cents, they weren't hedging or diversifying—they were making a specific bet that the tax selling had created a temporary mispricing. When Morgans clients accumulated AVH at $2.50, they weren't following a momentum strategy—they were acting on research that suggested the company was worth significantly more.
Key Indicators to Watch:
- Sudden activity from usually quiet brokers - When a boutique firm that rarely trades a stock suddenly becomes active, pay attention
- Contrarian timing - Professional buying during obvious tax selling periods often signals value recognition
- Clean entry and exit points - Boutique brokers often demonstrate clear conviction with decisive buying and selling
- Multiple boutique brokers - When several professional firms independently identify the same opportunity
Tracking These Signals in MarketLens:
The Company Broker Report feature allows you to spot these patterns by showing accumulation and distribution charts over time. During tax season, look for:
- Spikes in professional broker buying during price declines
- Sustained accumulation by boutique brokers over 2-4 week periods
- Clear divergence between retail selling and professional buying
Risk Considerations:
Remember that boutique broker activity, while often informed, isn't infallible. Small cap stocks carry inherent risks, and even professional money can be wrong. However, when you can identify clear patterns of informed buying during tax selling pressure, it provides valuable insight into potential opportunities that the broader market may have overlooked.
The key is recognizing that in small caps, professional broker activity often provides the best available signal about informed money movement—especially during tax season when emotional selling can create significant mispricings.
In small caps, track when usually-quiet professional brokers start buying. Their engagement often signals opportunities that larger institutions haven't yet discovered.
Ready to Apply These Strategies? Start Here
Now that you understand how tax season creates opportunities and how to spot them using broker data, you might be wondering how to put this knowledge into practice. Here are the key resources to get you started:
Learn the Fundamentals
If you're new to broker data analysis, start with our comprehensive guide: Following Smart Money: Understanding ASX Broker Data
This detailed guide covers:
- Introduction - What broker data is and why it matters
- From Theory to Practice - Real NAB case study showing institutional accumulation
- Professional vs Retail Behavior - Understanding different investor psychology
- Real-World Applications - News impact and trend analysis with Life360 and Xero examples
- Finding Opportunities - Using the Broker Screener to scan the entire market
Quick Start Guide
Ready to dive in? Our Quick Start Guide will have you analyzing broker data within minutes.
Essential Tools for Tax Season Analysis
📊 Company Broker Reports
Analyze individual stocks for tax season opportunities. Learn how to use Company Broker Reports to track accumulation and distribution patterns like we showed with ZIP and EVN.
🔍 Broker Screener
Scan the entire ASX for tax season opportunities. Master the Broker Screener to find stocks where professionals are buying while retail investors are selling.
👥 Broker Groups
Create custom groups like "Investment Banks" vs "Retail Brokers" to spot the divergences we discussed. Learn about Broker Groups to analyze collective behavior patterns.
📈 Tax Season Timing
Understanding when to look for these opportunities is crucial. Tax loss selling typically intensifies in May-June, but the best opportunities often emerge in the months following.
Begin by tracking a few stocks you know well using Company Broker Reports, then expand to screening the broader market once you're comfortable reading the patterns.
Don't Miss This Year's Opportunities
The patterns revealed in these examples aren't coincidence—they're the result of predictable human behaviour meeting market mechanics. Every June, the same drama repeats: retail investors sell for tax reasons while professional money hunts for bargains.
The difference between profiting from this cycle and missing it entirely comes down to information. You need to see what the smart money is doing while it's happening, not months later in quarterly reports.
MarketLens gives you that real-time window into professional money movement. Whether it's investment banks accumulating during retail panic or boutique brokers signalling interest in overlooked small caps, the data is there—you just need to know how to read it.
Start your free trial of MarketLens today and see what the professionals are buying while others are selling.
Start Analyzing Tax Season Opportunities Today
This analysis is for educational purposes only and does not constitute financial advice. Always conduct your own research and consider your financial situation before making investment decisions.