Features & Pricing Plans
Choose the perfect plan to unlock the power of ASX broker data analysis. From essential trading tools to advanced institutional-grade analytics.
CORE ANALYSIS TOOLS
Company Broker Report
Transform broker transaction data into actionable insights. Track and analyze broker activities for any ASX-listed company with detailed buy/sell data and visualization tools.
Key Capabilities:
- Detailed broker activity analysis
- Buy/sell volume and value tracking
- Interactive price trend visualization
- ASX & Cboe (Chi-X) data coverage (Professional & Elite)
Data Coverage:
- Trader: 6 months history (ASX only)
- Professional: 2 years history
- Elite: 5 years history
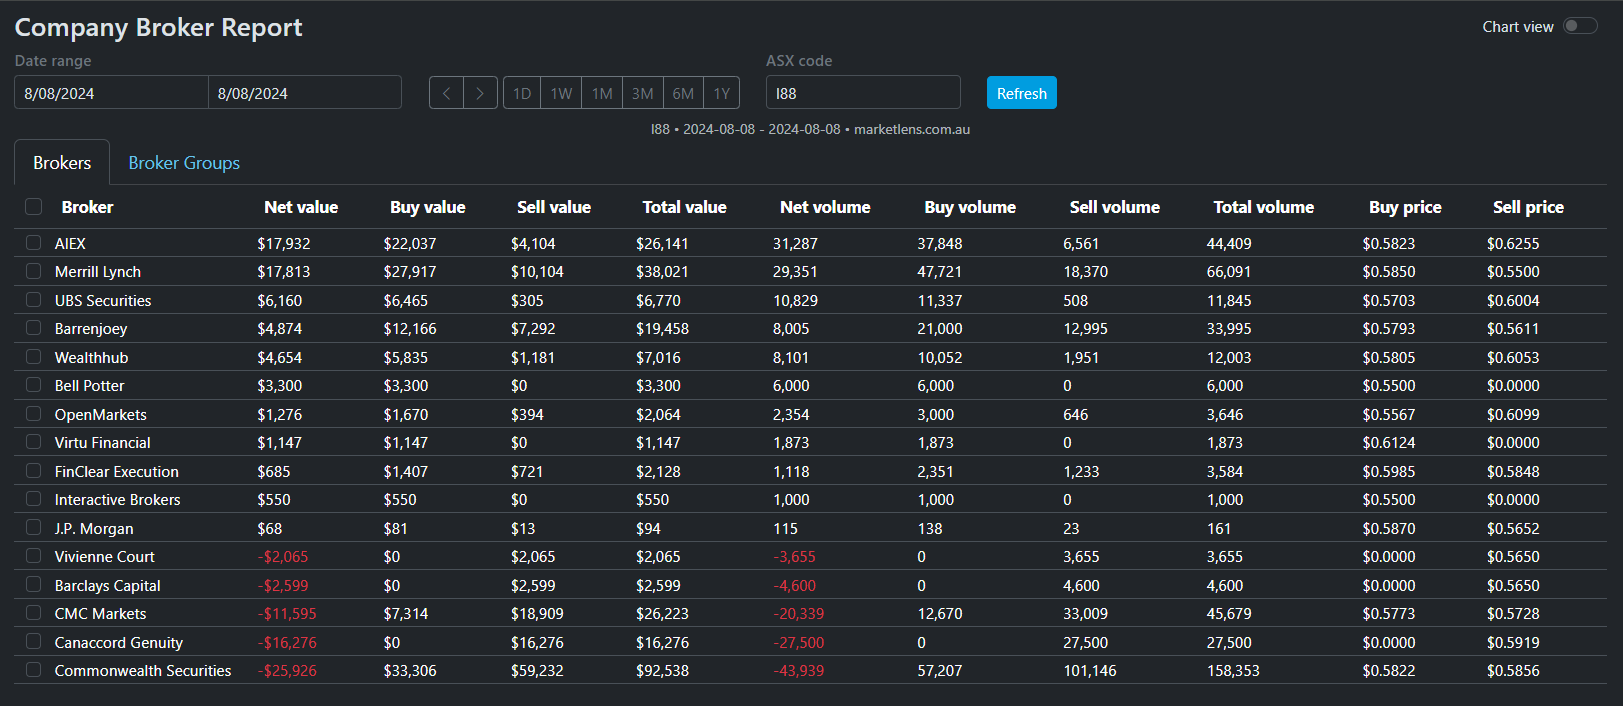
Traditional Table View
The table view provides a comprehensive breakdown of broker activity. Each row represents a broker's trading activity, showing:
- Buy and sell volumes with net position
- Total value traded and average prices
- Sortable columns for quick analysis
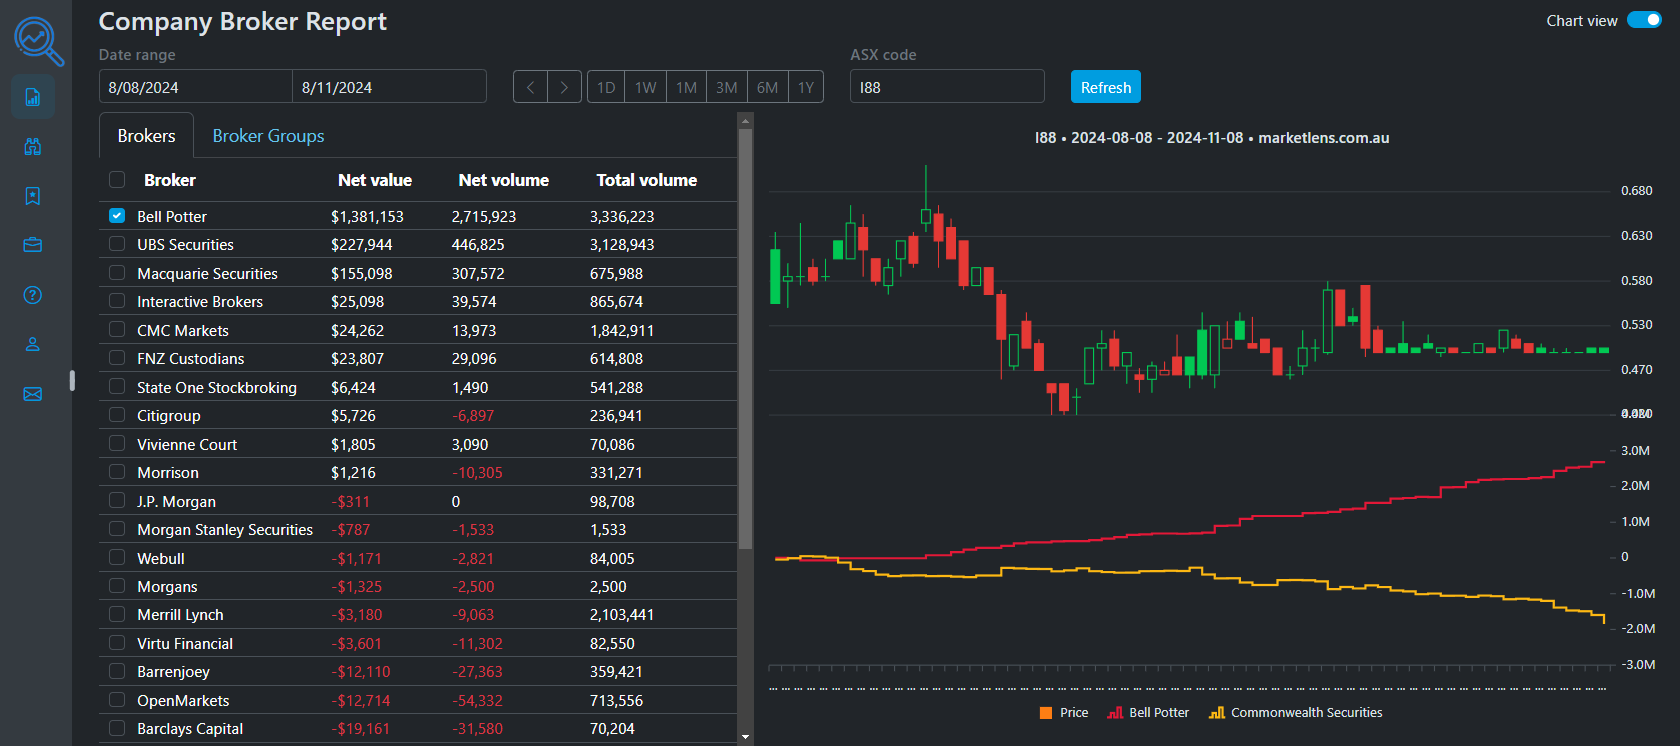
Advanced Chart View
The chart view transforms complex data into clear visual patterns, helping you:
- Track accumulation/distribution trends over time
- Compare broker activity against price movements
- Identify professional buying/selling patterns
- Spot divergences between price and broker activity
Select multiple brokers or broker groups to overlay their activities, making it easy to spot when professional investors are accumulating while retail traders are selling.
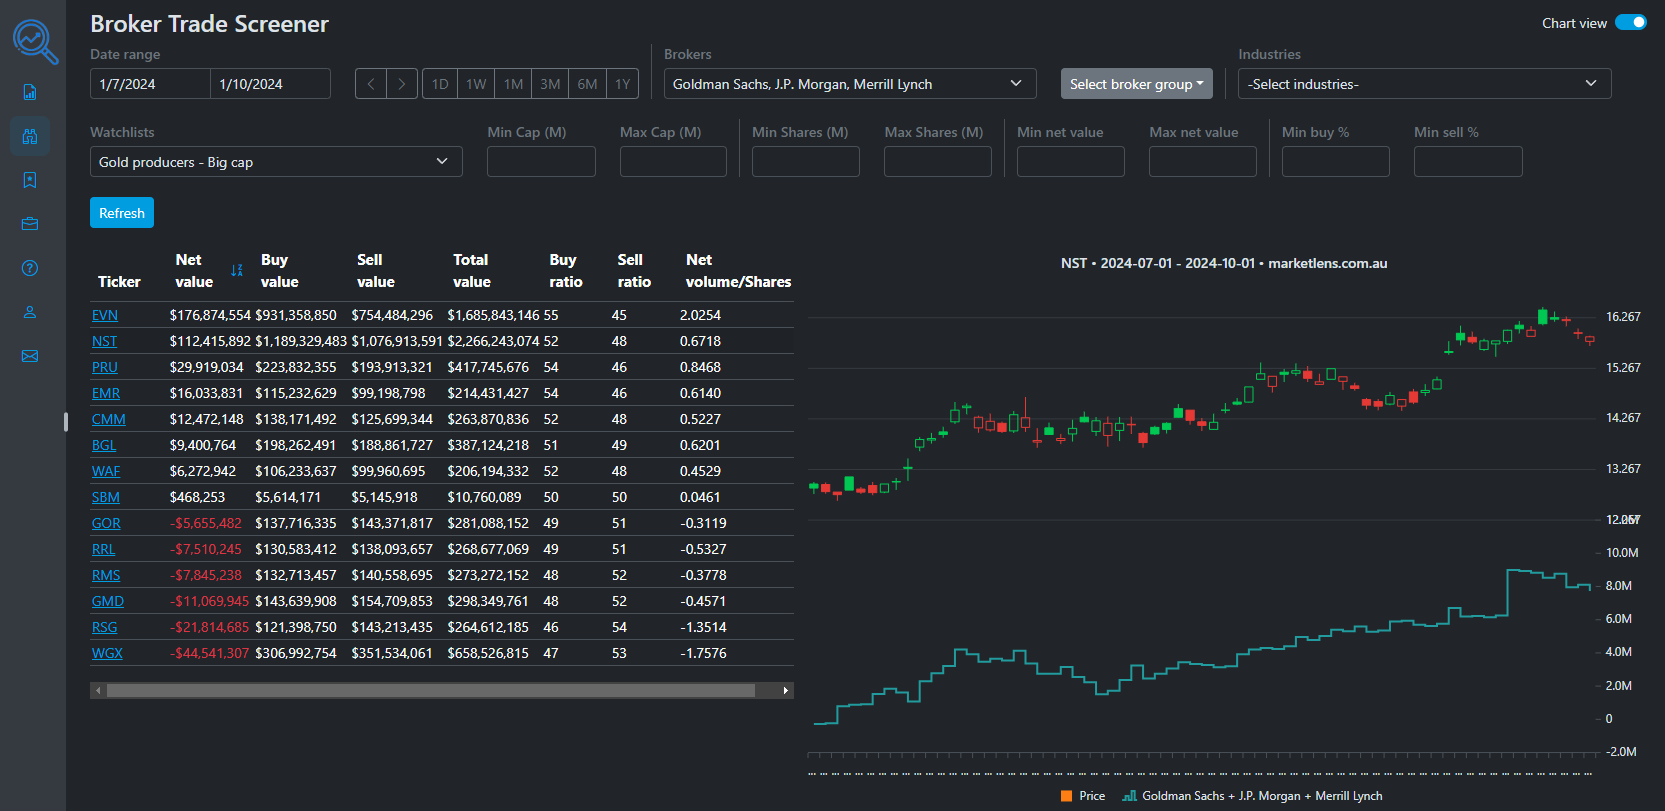
Broker Trade Screener
Scan the entire market to discover opportunities based on broker activity patterns. Filter and identify stocks where professional investors are actively accumulating positions.
Key Features:
- Advanced filtering system
- Market segment analysis
- Custom watchlist integration (Professional & Elite)
- Broker group analysis (Professional & Elite)
Plan Features:
- Trader: Basic filters, single broker analysis
- Professional: Multiple broker analysis, predefined groups
- Elite: All features, maximum historical data
TRANSACTION ANALYSIS TOOLS
Get unprecedented visibility into market dynamics with our new suite of transaction analysis tools.
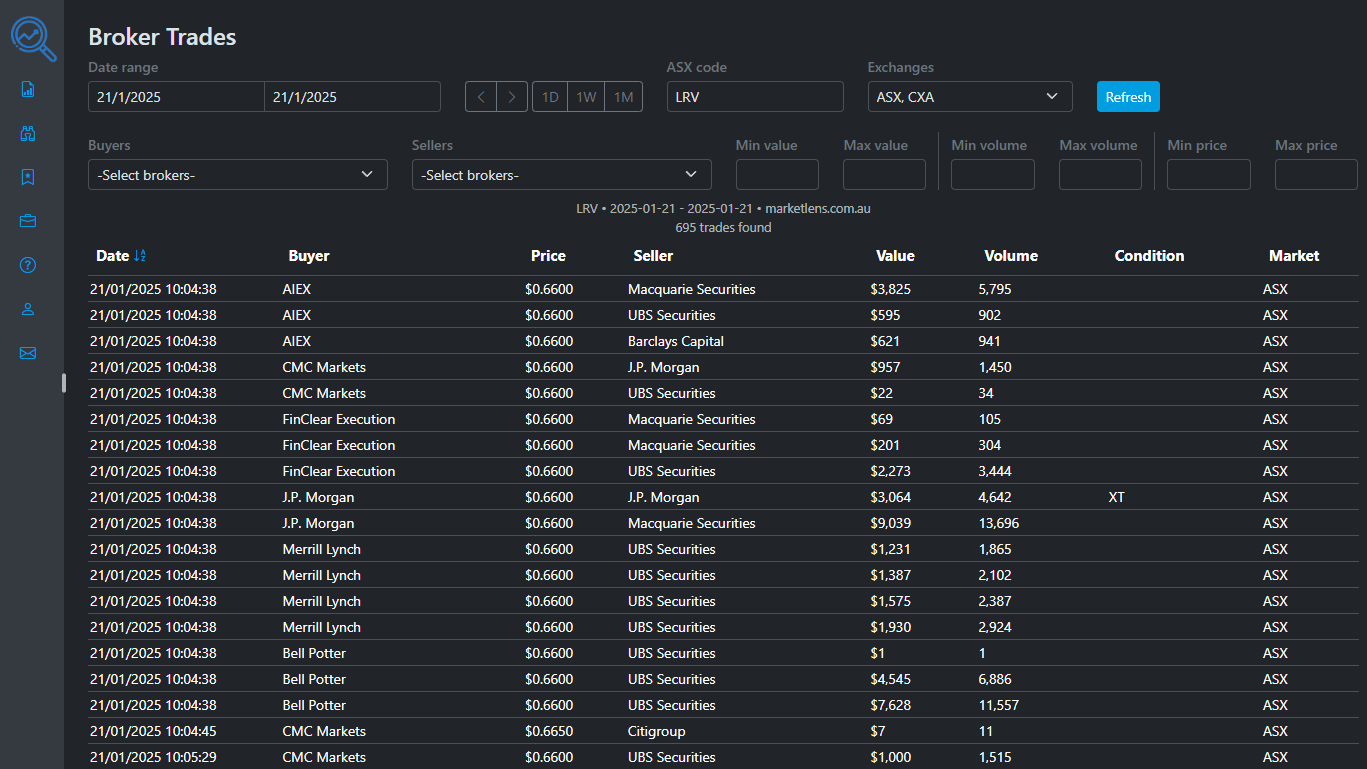
Raw Broker Trades
Access granular transaction-level data showing every broker trade. See exactly who's moving the market with complete details of time, price, volume, and participating brokers.
Key Features:
- Detailed transaction data in chronological order
- Filter by buying or selling brokers
- Narrow down by price range, value, or volume
- Track intraday trading patterns
Data Availability:
- Professional: Latest trading day (T+3)
- Elite: One month of history
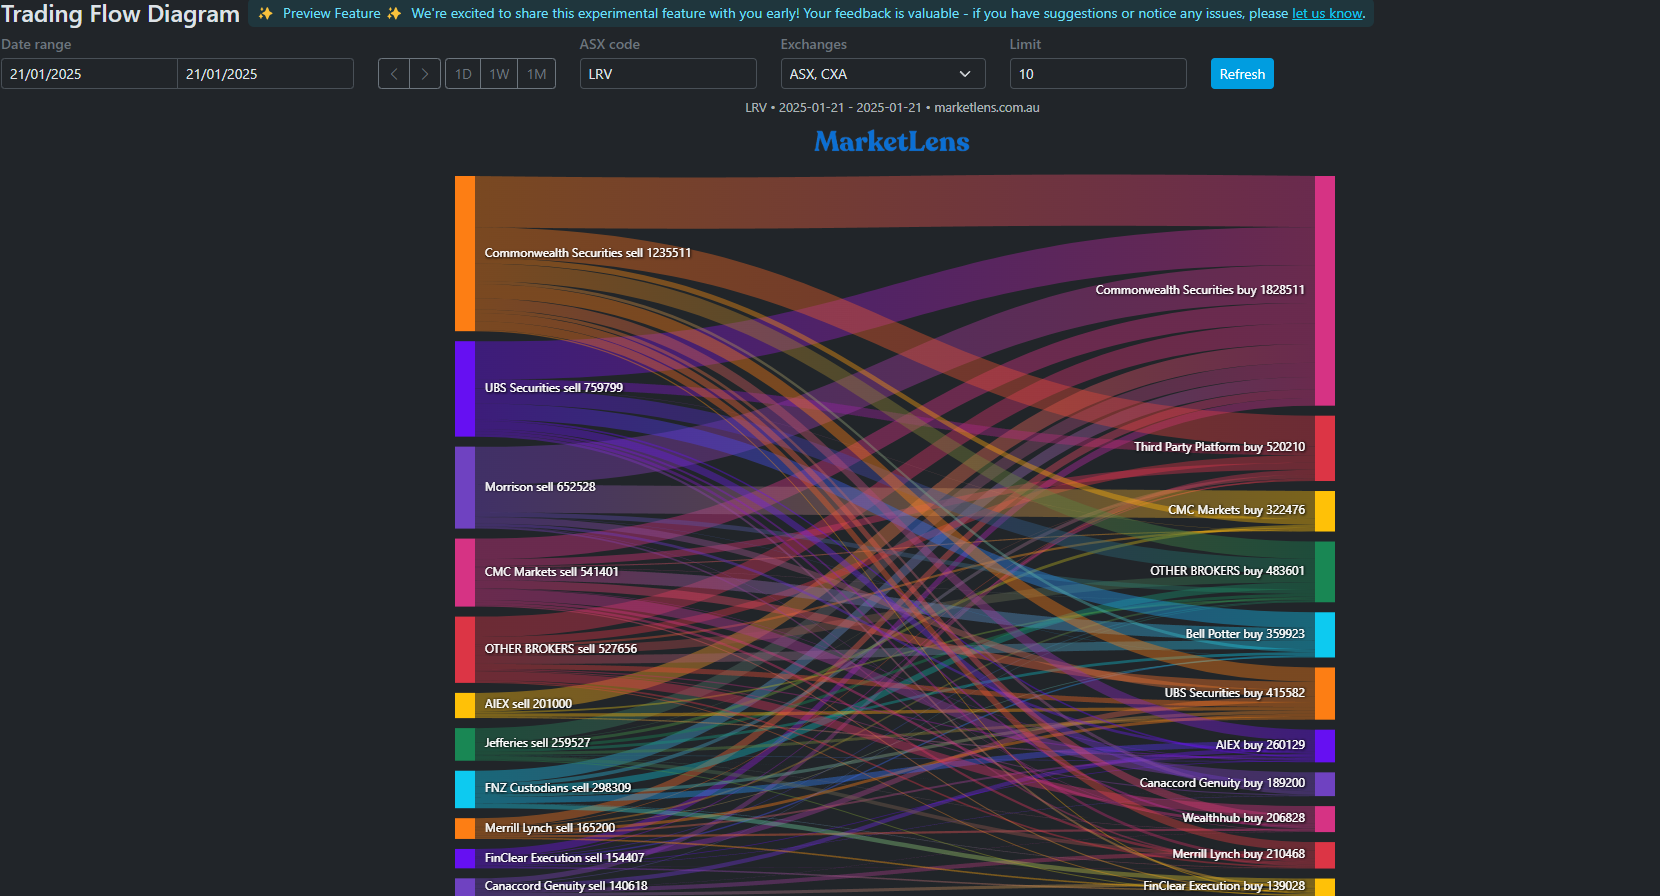
Trading Flow Diagram
Visualize share movement between brokers using an innovative Sankey diagram to reveal trading relationships and patterns between market participants.
Key Features:
- Visualize share flow between brokers
- Identify major market participants
- Track volume relationships
- Understand trading patterns
Data Availability:
- Professional: Latest trading day (T+3)
- Elite: One month of history
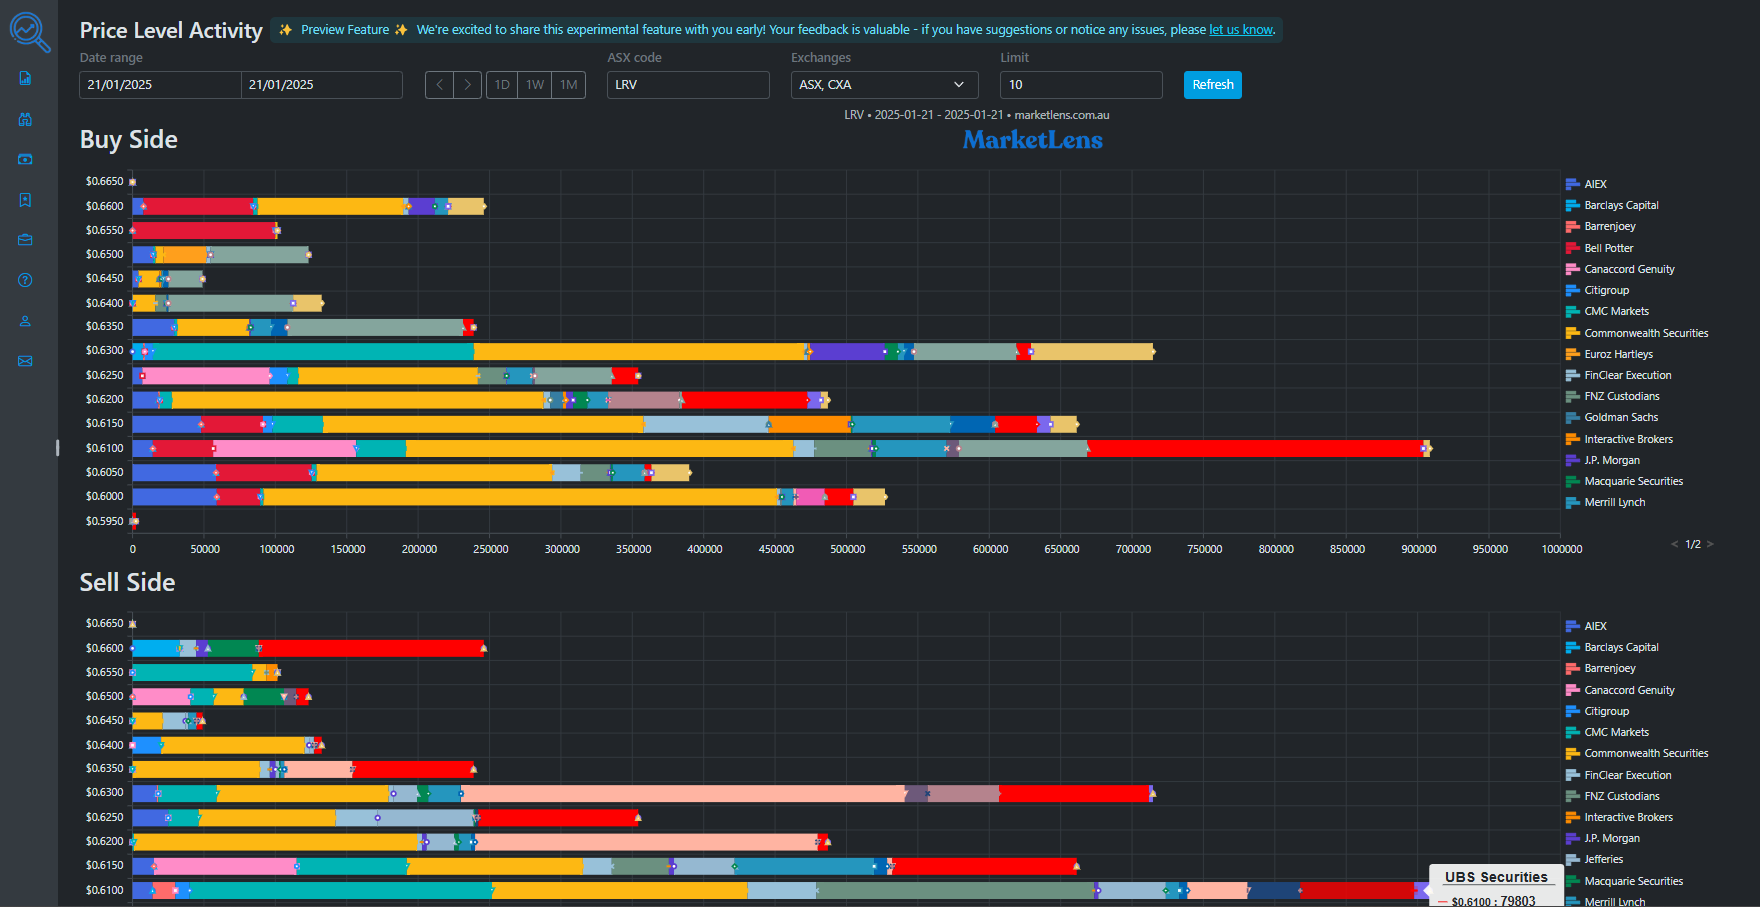
Price Level Activity
Analyze broker activity at each price point to identify meaningful support and resistance levels, distinguishing between professional and retail trading zones.
Key Features:
- View buy and sell activity by price level
- Identify potential support and resistance levels
- Spot professional accumulation zones
- Track broker positioning patterns
Data Availability:
- Professional: Latest trading day (T+3)
- Elite: One month of history
ORGANIZATION TOOLS
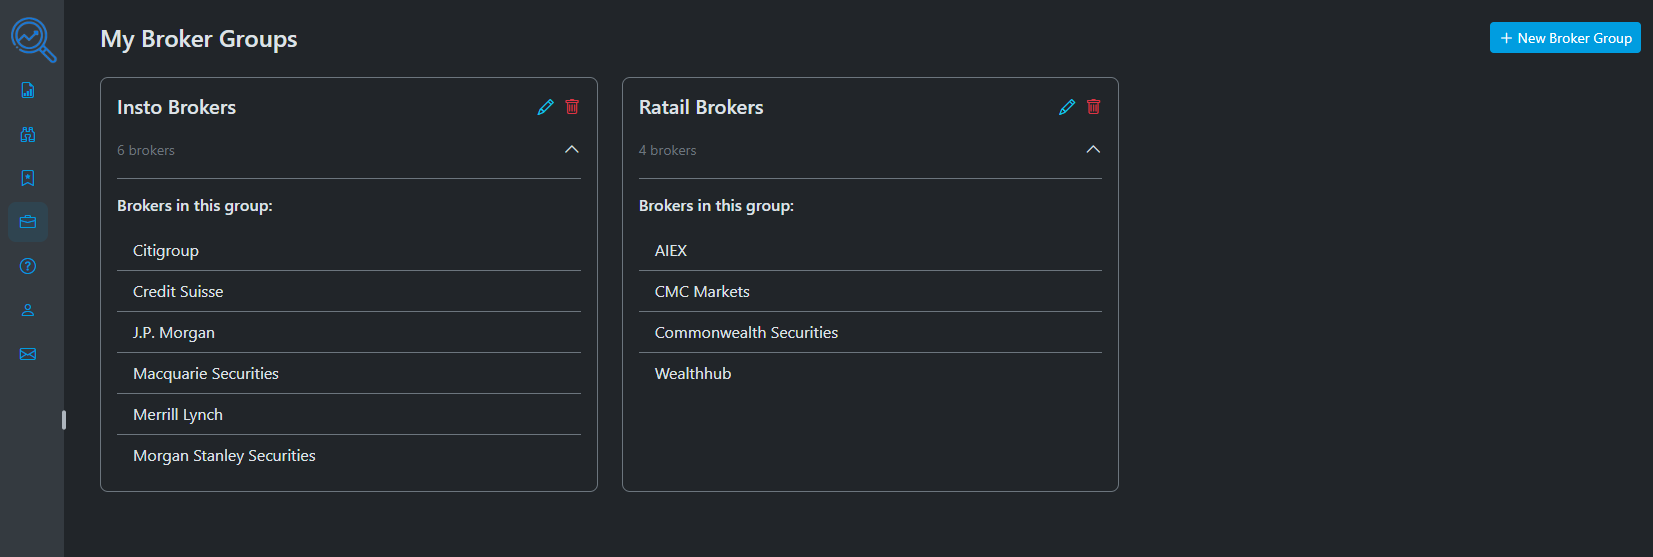
Broker Groups
Create custom groups to analyze collective broker behavior and track institutional versus retail activity. Identify patterns in group trading behavior that may signal significant market moves.
Key Features:
- Create custom broker categories
- Track group-level activity
- Compare institutional vs retail patterns
- Integrate with all analysis tools
Plan Limits:
- Professional: Up to 10 broker groups
- Elite: Unlimited broker groups
Group-Level Analysis View
Compare trading activities between different broker groups. In this example, we're tracking two key groups:
- Investment Banks: Combined activity of Goldman Sachs, J.P. Morgan, UBS Securities, and other institutional brokers
- Retail Brokers: Aggregated data from CommSec, AIEX, and other retail-focused brokers
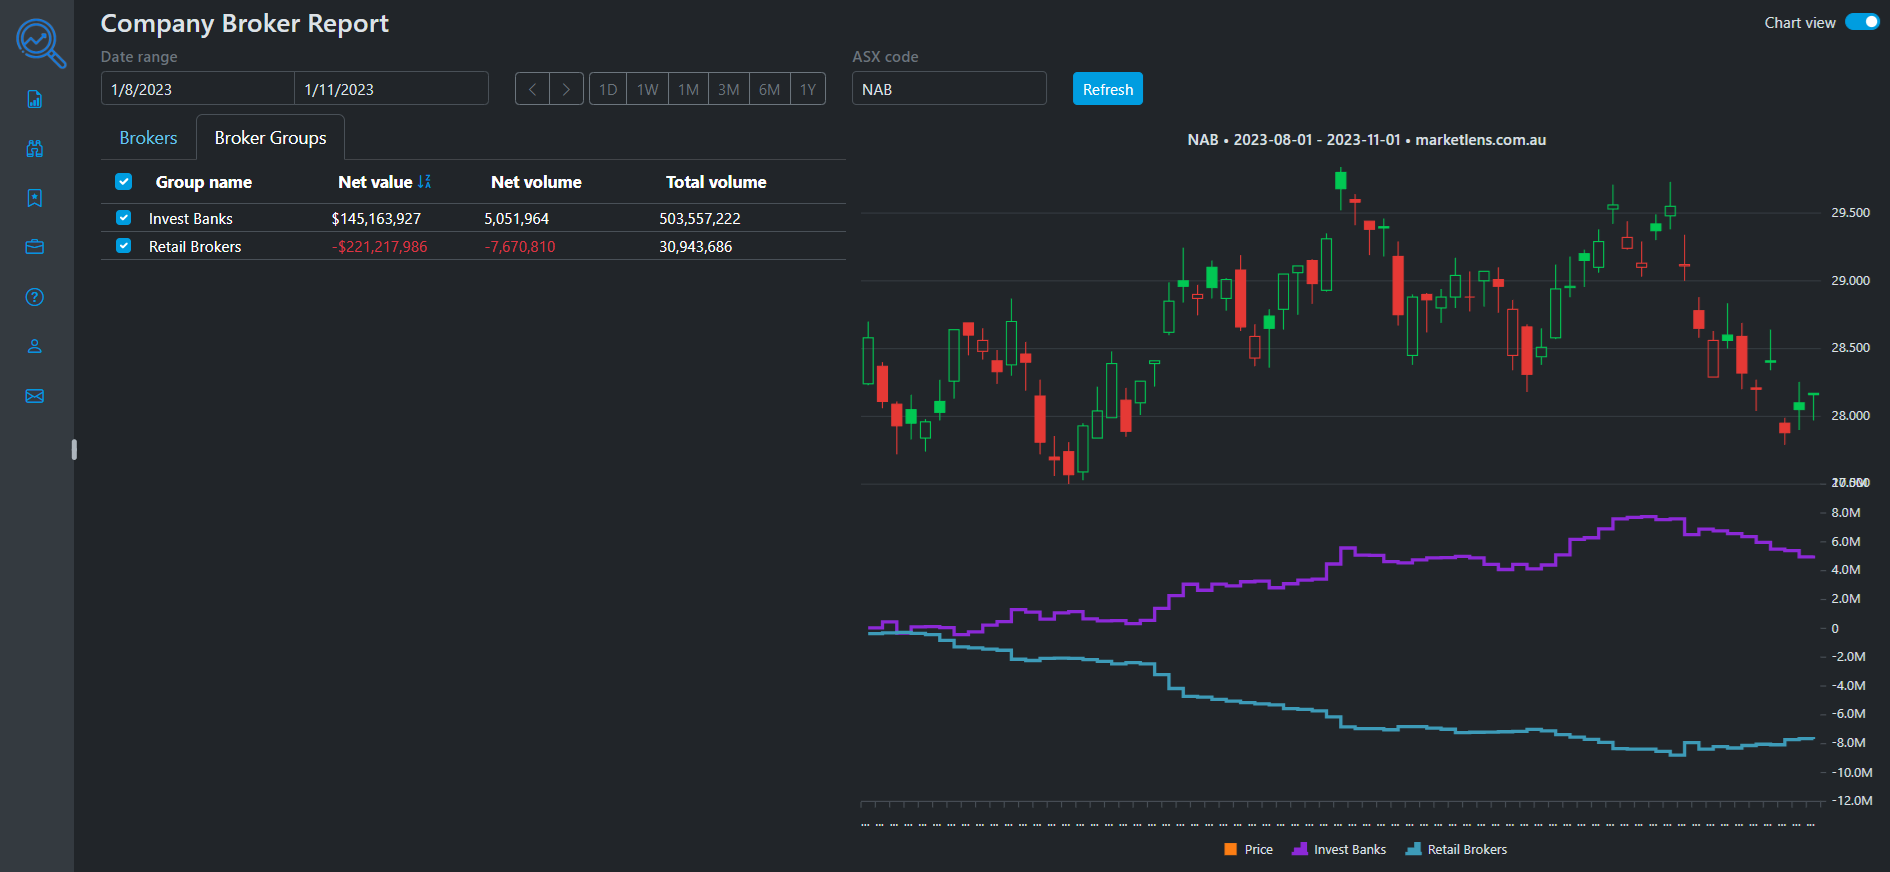
Group Accumulation Trends
The chart visualization reveals powerful insights about group behavior over time:
- Clear Pattern Recognition: Easily spot when investment banks are accumulating while retail traders are selling
- Trend Analysis: Track the pace of accumulation or distribution for each group
- Volume Impact: See the relative size of group trading activity compared to price movements
- Divergence Signals: Identify opportunities when professional and retail sentiment diverge
In this example, we can see investment banks steadily accumulating shares while retail brokers are net sellers - a potential signal of professional confidence in the stock.
Watchlists
Organize and monitor your focus stocks with custom watchlists for targeted analysis. Streamline your research process and never miss an opportunity in your preferred market segments.
Key Features:
- Create custom stock lists
- Filter by watchlist in screener
- Add personal notes to stocks
- Quick access to favorite companies
Plan Limits:
- Professional: Up to 10 watchlists
- Elite: Unlimited watchlists
Preview Features Notice
The Trading Flow Diagram and Price Level Activity features are currently in preview and may be enhanced based on user feedback.
CHOOSE YOUR PLAN
Select the plan that best fits your trading needs and analysis requirements.
Trader Plan
Essential tools for individual traders
Core Features:
- Comprehensive broker transaction reports
- ASX broker data only
- Access to 6 months of historical data
- Advanced data visualization with chart view
- Powerful market screening with industry and cap filters
Limitations:
- No Cboe (Chi-X) data
- No broker groups
- No watchlists
- No transaction analysis tools
Professional Plan
Advanced tools for serious traders
Everything in Trader, plus:
- ASX and Cboe (Chi-X) broker data
- Extended 2-year historical data
- Group broker behavior analysis
- Watchlist-based market screening
- Access to raw transactions (latest day)
- Transaction analysis tools (latest day)
- Create up to 10 custom broker groups
- Build up to 10 strategic watchlists
- Multiple broker analysis
Elite Plan
Maximum power for institutional traders
Everything in Professional, plus:
- ASX and Cboe (Chi-X) broker data
- Complete 5-year historical data
- Access to raw transactions (1 month)
- Transaction analysis tools (1 month)
- Unlimited broker groups
- Unlimited watchlists
- Early access to new features
Start analyzing broker data today
Join successful ASX traders who use MarketLens to follow smart money, validate trading ideas, and discover opportunities before they become obvious to the market.
MarketLens: Your window into ASX broker data and smarter trading decisions.